

[et_pb_section admin_label=”section”][et_pb_row admin_label=”Row”][et_pb_column type=”1_4″][et_pb_text admin_label=”Text” background_layout=”light” text_orientation=”left” use_border_color=”off” border_color=”#ffffff” border_style=”solid”]
![]()
[/et_pb_text][/et_pb_column][et_pb_column type=”3_4″][et_pb_text admin_label=”Major advertisers” background_layout=”light” text_orientation=”left” use_border_color=”off” border_color=”#ffffff” border_style=”solid” module_id=”Major advertisers”]


by Frank Vespe
Like a lot of horse racing data, jockey and trainer statistics tend to be pretty stripped down. Wins and total earnings pretty much occupy the field, and if you see a list of jocks (or trainers), it’s likely to be ordered by one or the other.
Of course, the question of who the best jockey is is a complex one. Even with, for example, Trakus data to tell us how much ground a jockey may have lost on a given mount, what we don’t know is whether he lost the ground via pilot error, circumstances out of his control — or a purposeful decision that a certain part of the course was better than the inside.
But even using the data we have, we ought to be able to develop a better picture of who’s having a good year that simply wins or even total earnings. Why? Because those stats don’t entirely take into account how many mounts a jock has, or what quality of races they’re riding in.
[/et_pb_text][et_pb_text admin_label=”All advertisers” background_layout=”light” text_orientation=”left” use_border_color=”off” border_color=”#ffffff” border_style=”solid”]
So we developed an equation using wins, win percentage, and earnings per start as the key metrics. The number is designed only to compare jocks at one track to other jocks at the same track, and a perfect score would be 300.
We applied the metric to the jocks at Laurel Park with at least 25 starts to date this year. Here’s what we found:
JOCKEYS
RANK | EARNINGS RANK | JOCKEY | POINTS | WINS | WIN PCT | EARNINGS/START |
|---|---|---|---|---|---|---|
| 1 | 6 | Julian Pimentel | 260 | 18 | 26.87% | $7,783.39 |
| 2 | 1 | Trevor McCarthy | 257.3155 | 30 | 20.00% | $6,450.17 |
| 3 | 2 | Horacio Karamanos | 246.6579 | 23 | 21.10% | $7,117.83 |
| 4 | 3 | Victor R. Carrasco | 189.2246 | 19 | 15.32% | $5,359.43 |
| 5 | 5 | Feargal Lynch | 181.9372 | 18 | 16.07% | $4,834.71 |
| 6 | 8 | Alex Cintron | 172.8091 | 14 | 17.07% | $4,871.80 |
| 7 | 4 | Jevian Toledo | 170.4086 | 19 | 13.19% | $4,511.45 |
| 8 | 7 | Steve D. Hamilton | 169.1386 | 18 | 15.52% | $3,999.10 |
| 9 | 9 | Katie Davis | 143.9247 | 12 | 15.19% | $3,688.13 |
| 10 | 12 | Kevin Gomez | 135.8951 | 10 | 15.87% | $3,384.13 |
| 11 | 10 | Forest Boyce | 124.7687 | 9 | 12.33% | $3,804.38 |
| 12 | 11 | Jomar Torres | 97.52778 | 8 | 9.88% | $2,654.01 |
| 13 | 13 | Lauralea Glaser | 96.16271 | 6 | 11.76% | $2,519.63 |
| 14 | 25 | Silvestre Gonzalez | 83.95982 | 3 | 12.00% | $2,280.00 |
| 15 | 19 | Angel Serpa | 80.65753 | 3 | 10.00% | $2,602.40 |
| 16 | 15 | Carlos Quinones | 75.41002 | 3 | 7.69% | $2,862.54 |
| 17 | 14 | Jenn Miller | 72.98406 | 5 | 8.20% | $2,008.69 |
| 18 | 17 | Brian Pedroza | 70.83807 | 2 | 6.45% | $3,125.58 |
| 19 | 28 | Jan C. Batista | 59.24731 | 2 | 7.41% | $1,946.52 |
| 20 | 18 | Anna Carrow | 39.74233 | 2 | 3.70% | $1,501.39 |
| 21 | 21 | Yomar Orlando Ortiz | 37.22686 | 2 | 3.64% | $1,325.11 |
[/et_pb_text][et_pb_text admin_label=”Text” background_layout=”light” text_orientation=”left” use_border_color=”off” border_color=”#ffffff” border_style=”solid”]
[/et_pb_text][et_pb_text admin_label=”2nd part of story” background_layout=”light” text_orientation=”left” use_border_color=”off” border_color=”#ffffff” border_style=”solid”]
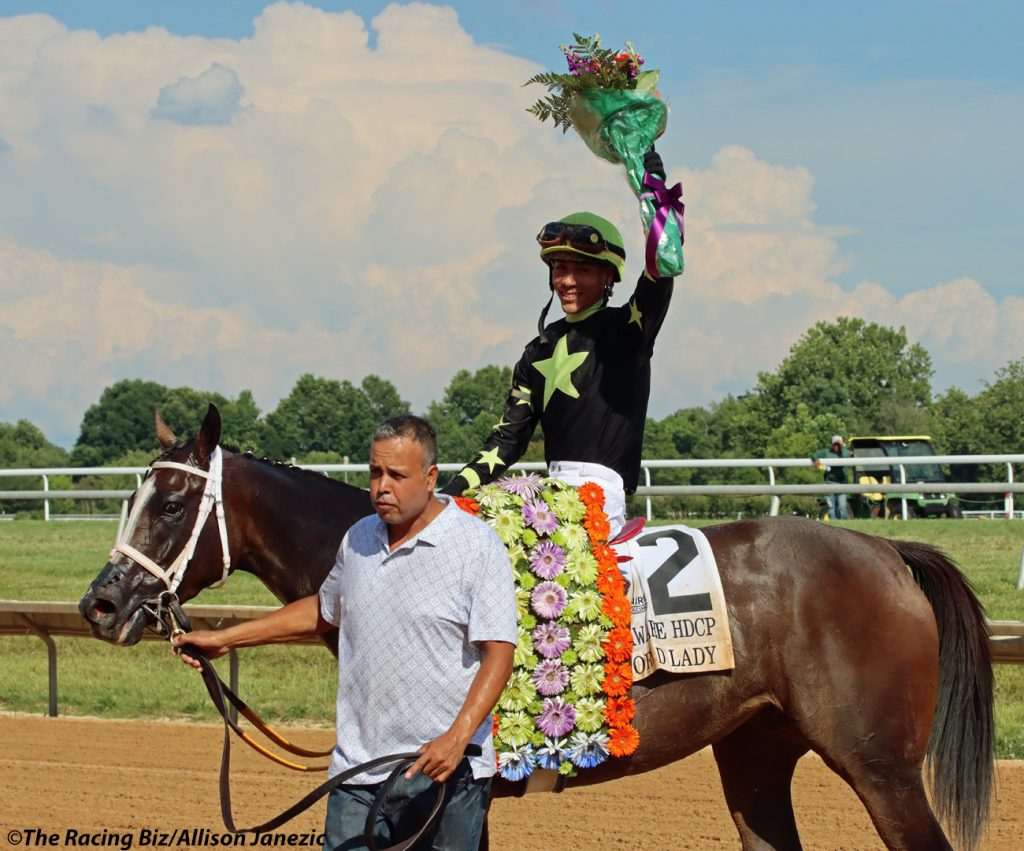
Perhaps the biggest surprise was that Julian Pimentel — sixth by earnings in the colony and 11th by starts — zooms to the top of the list. In this metric, he gets high marks for leading the colony in win percentage (27 percent) and earnings per start. That suggests that the 36-year-old has picked his spots effectively and done well in big-money races. He’s also been a little bit lucky: his win aboard Imperial Hint in the Grade 3 General George, for example, came only after Trevor McCarthy turned down that mount for another horse in the same race.
Pimentel, McCarthy, and another veteran, Horacio Karamanos are all part of a three-man cluster atop the standings. All three have win percentages of at least 20 percent and per-start earnings of at least $6,450, well above the average of all riders in the sample ($4,311).
Two more clusters follow, with five jockeys scoring between 169 and 190, and then a group of three with between 124 and 144 points. Among the riders ranking higher here than in standard metrics are Alex Cintron, sixth on this list despite being eighth in total earnings, and Kevin Gomez, 10th here despite being 12th in both total earnings and starts.
After them come 10 more jocks with scores below 100. The biggest mover in this group is Silvestre Gonzalez. Despite being 25th in colony earnings — and 20th in this group of qualifying jockeys — he rises to 14th place here with almost 84 points.
Of course, we can perform a similar calculation on trainers. Though the data is a little more unreliable — it takes trainers a while to amass enough starts to compose a meaningful sample — here are the top 10 trainers among those who’ve made at least 18 starts to date.
TRAINERS
RANK | EARNINGS RANK | JOCKEY | POINTS | WINS | WIN PCT | EARNINGS/START |
|---|---|---|---|---|---|---|
| 1 | 1 | Claudio A. Gonzalez | 273.7917 | 16 | 29.09% | $7,333.84 |
| 2 | 21 | Jonathan Maldonado | 223.5636 | 7 | 38.89% | $5,913.33 |
| 3 | 5 | Michael J. Trombetta | 195.7984 | 10 | 20.83% | $5,906.92 |
| 4 | 15 | H. Graham Motion | 177.4106 | 5 | 23.81% | $6,292.86 |
| 5 | 4 | Cathal A. Lynch | 175.1307 | 6 | 14.63% | $7,408.93 |
| 6 | 6 | Mary E. Eppler | 173.5279 | 8 | 17.39% | $5,838.78 |
| 7 | 3 | Kieron Magee | 173.4873 | 11 | 16.18% | $4,678.04 |
| 8 | 10 | Gary Capuano | 161.4739 | 4 | 16.67% | $6,936.00 |
| 9 | 14 | Rudy R. Rodriguez | 153.1189 | 4 | 18.18% | $6,028.32 |
| 10 | 11 | Scott A. Lake | 144.9731 | 7 | 18.42% | $3,990.05 |
[/et_pb_text][et_pb_text admin_label=”Minor advertisers” background_layout=”light” text_orientation=”left” use_border_color=”off” border_color=”#ffffff” border_style=”solid”]


JessE lIVERMORE
11th Mar 2017I’m curious.
What is the math behind developing the score?
The Biz
11th Mar 2017pretty quick and dirty: 100 is max in each category, meet leader gets 100, others get less based on percentage of winner’s total